1.1 Changing in Tandem
Activity 1.1.2
Consider the tank in the shape of an inverted circular cone (point down) where the tank's radius is [latex]2[/latex] feet and its depth is [latex]4[/latex] feet. Suppose that the tank is being filled with water that is entering at a constant rate of [latex]0.75[/latex] cubic feet per minute.
a. Sketch a labeled picture of the tank, including a snapshot of there being water in the tank prior to the tank being completely full.
b. What are some quantities that are changing in the scenario? What are some quantities that are not changing?
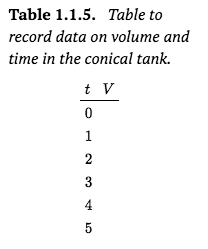
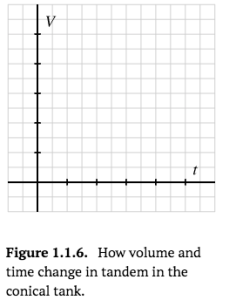
c. Fill in the following table of values to determine how much water, [latex]V[/latex], is in the tank at a given time in minutes, [latex]t[/latex], and thus generate a graph of the relationship between volume and time by plotting the data on the provided axes.
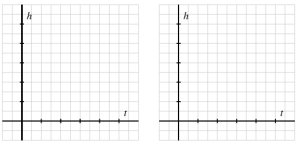
d. Finally, think about how the height of the water changes in tandem with time. Without attempting to determine specific values of [latex]h[/latex] at particular values of [latex]t[/latex], how would you expect the data for the relationship between [latex]h[/latex] and [latex]t[/latex] to appear? Use the provided axes to sketch at least two possibilities; write at least one sentence to explain how you think the graph should appear.
Show Solution
a. 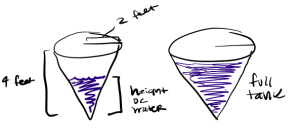
b. Some of the quantities that are changing are the radius of the water, the depth of the water, the volume of the water, and time. Some of the quantities that are not changing are the radius of the tank, the height of cone, the rate at which the water is entering, and the volume when the tank is full.
c. 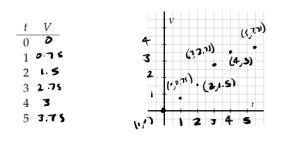
d. 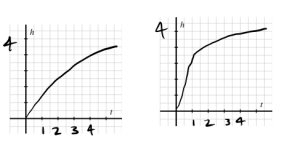
The height of the water should increase quickly at first since the cone is pretty narrow at the bottom but then as time increases the rate at which the water enters should increase at a slower rate as the tank gets wider.
Activity 1.1.3
Consider a tank in the shape of a sphere where the tank's radius is [latex]3[/latex] feet. Suppose that the tank is initially completely full and that it is drained by a pump at a constant rate of [latex]1.2[/latex] cubic feet per minute.
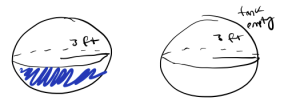
a. Sketch a labeled picture of the tank, including a snapshot of some water remaining in the tank prior to the tank being completely empty.
b. What are some quantities that are changing in this scenario? What are some quantities that are not changing?
c. Recall that the volume of a sphere of radius [latex]r[/latex] is [latex]V = \frac{4}{3}\pi r^3[/latex]. When the tank is completely full at [latex]t = 0[/latex] right before it stats being drained, how much water is present?
d. How long will it take for the tank to drain completely?
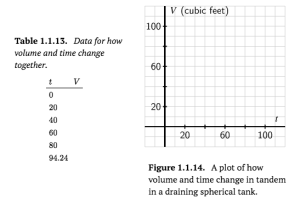
e. Fill in the following table of values to determine how much water, [latex]V[/latex], is in the tank at a given time in minutes, [latex]t[/latex], and thus generate a graph of the relationship between volume and time. Write a sentence to explain why the data's graph appears the way it does.
f. Finally, think about how the height of the water changes in tandem with time. What is the height of the water when [latex]t = 0[/latex]? What is the height when the tank is empty? How would you expect the data for this relationship between [latex]h[/latex] and [latex]t[/latex] to appear? Use the provided axes to sketch at least two possibilities; write at least one sentence to explain how you think the graph should appear.
Show Solution
a.
b. Some of the quantities that are changing in this scenario is the amount of water in the sphere (volume), the height of the water, the radius of the water, and time. Some quantities that are not changing are the radius of the sphere and the rate at which the water is decreasing.
c. The maximum possible volume of the tank is when the radius of the water matches the radius of the tank that is [latex]r = 3[/latex]. So, plugging that in we get [latex]V = \frac{4}{3}\pi(3)^3 = 36\pi \approx 113.04[/latex]. So the tank is completely full at [latex]113.04 \hspace{0.5mm} ft^3[/latex]
d. We know that the maximum possible volume of the tank is at [latex]113.04 \hspace{0.5mm} ft^3[/latex] and we know that the water is decreasing at [latex]1.2[/latex] cubic feet per minute. So the time it takes for the tank to drain completely is [latex]\frac{36\pi}{1.2} \approx 94.24[/latex]. So it will take [latex]94.24[/latex] minutes for the tank to drain completely.
e.
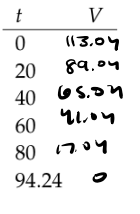
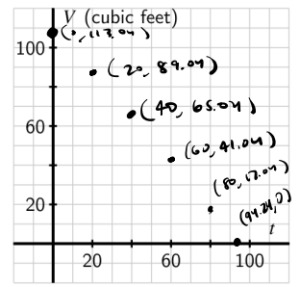
So I know when [latex]t = 0[/latex] the tank is full so the graph starts at [latex]113.04[/latex] because that is the maximum volume of the tank. Then we know that the amount of water is decreasing at a constant rate so the graph should resemble a linear line.
f.
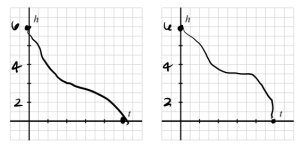
When [latex]t = 0[/latex] the height of the water is [latex]6[/latex] feet. When the tank is empty the height of the water is [latex]0[/latex] feet. The height of the water should decrease rapidly at first since the tank is more narrow to the top then as it gets to the middle it will decrease at a slower rate as the tank widens. Finally, as we get near the bottom of the tank the water will decrease at a faster rate again.
