3.2 Modeling with Exponential Functions
Activity 3.2.2
For each of the following functions, without using graphing technology, determine whether the function is
-
- always increasing or always decreasing
- always concave up or always concave down; and
- increasing without bound, decreasing without bound, or increasing/decreasing towards a finite value.
In addition, state the y-intercept and the range of the function. For each function, write a sentence that explains your thinking and sketch a rough graph of how the function appears.
- [latex]p(t) = 4372(1.000235)^t+92856[/latex]
- [latex]q(t) = 27931(0.97231)^t+549786[/latex]
- [latex]r(t) = -17398(0.85234)^t[/latex]
- [latex]s(t)=-17398(0.85234)^t+19411[/latex]
- [latex]u(t) = -7522(1.03817)^t[/latex]
- v(t) = [latex]-7522(1.03817)^t+6731[/latex]
Show Solution
a.
i. increasing
ii. concave up
iii. increasing without bound
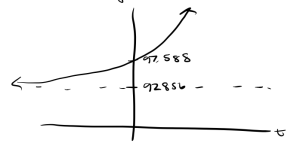
y-intercept: [latex]p(0) = 4732(1.00235)^0 + 93856 = 4732+92856 = 97588[/latex].
range: [latex](97588, \infty)[/latex]
Since [latex]a = 4732 > 1[/latex] and [latex]b =1.00235 > 1[/latex], then we know the function is always increasing and concave up. We also know that there is a horizontal asymptote at [latex]y = 92856[/latex]. So, our graph looks like this:
b.
i. decreasing
ii. concave up
iii. decreasing towards a finite value.
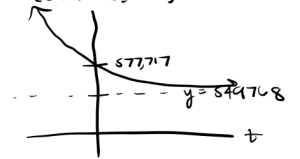
y-intercept: [latex]q(0) = 27931+5497686 = 577717[/latex].
range: [latex](549786, \infty)[/latex]
Since [latex]b > 1[/latex] then we know the function is decreasing. Also, since [latex]a > 1[/latex] there is no reflection across the [latex]x[/latex]-axis so the function will be decreasing towards a finite value and will be concave up. We also know there is a horizontal asymptote at [latex]y = 0[/latex]. So, our graph looks like this:
c.
i. increasing
ii. concave down
ii. increasing towards a finite value.
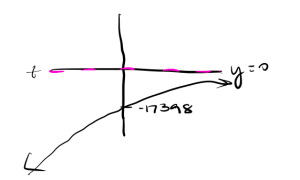
y-intercept: [latex]r(0) = -17398(0.85234)^0 = -17398[/latex].
range: [latex](-\infty, 0)[/latex]
The parent function [latex]y = (0.85234)^t[/latex] is decreasing since [latex]b < 1[/latex]. However in [latex]r(t)[/latex], since [latex]a = -17398 < 1[/latex] then we have a reflection across the [latex]x[/latex]-axis so [latex]r(t)[/latex] becomes an increasing function that is concave down. We also know that there is horizontal asymptote at [latex]y = 0[/latex] so our function is increasing towards a finite value. So our graph looks like this:
d.
i. increasing
ii. concave down
iii. increasing towards a finite value
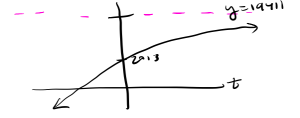
y-intercept: [latex]s(0) = -17398(0.85234)^0 + 19411 = -17398+19411=2013[/latex]
range: [latex](-\infty, 19411)[/latex]
The parent function [latex]y = (0.85234)^t[/latex] is decreasing since b < 1. However in [latex]s(t)[/latex], since [latex]a = -17398 < 1[/latex] then we have a reflection across the x-axis so [latex]s(t)[/latex] becomes an increasing function that is concave down. We also know that there is a horizontal asymptote at [latex]y = 14911[/latex] so our function is increasing towards a finite value. So our graph looks like this,
e.
i. decreasing
ii. concave down
iii. decreasing without bound
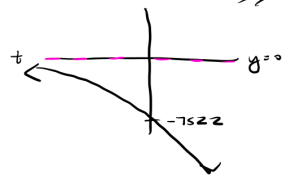
y-int: [latex]u(0) = -7522(1.03817)^t = -7522[/latex].
range: [latex](-\infty,0)[/latex]
The parent function [latex]y = (1.03817)^t[/latex] is increasing since [latex]b > 1[/latex]. However with [latex]u(t)[/latex], since [latex]a = -7522 < 1[/latex] this is a reflection across the [latex]x[/latex]-axis which makes [latex]u(t)[/latex] a decreasing function that is concave down. We also know there is a horizontal asymptote at [latex]y = 0[/latex] so our function is decreasing without bound. So our graph looks like:
f.
i. decreasing
ii. concave down
iii. decreasing without bound.
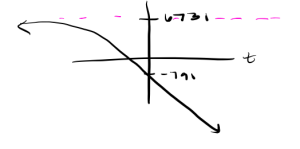
y-int: [latex]v(0) = -7522(1.03817)^t+6731 = -791[/latex]
range: [latex](-\infty,6731)[/latex]
The parent function [latex]y = (1.03817)^t[/latex] is increasing since [latex]b > 1[/latex]. However with [latex]y(t)[/latex], since [latex]a = -7522 < 1[/latex] this is a reflection across the [latex]x[/latex]-axis which makes [latex]v(t)[/latex] a decreasing function that is concave down. We also know there is a horizontal asymptote at [latex]y = 6731[/latex]so our function is decreasing without bound. So our graph looks like:
Activity 3.2.3(a-d)
A can of soda (at room temperature) is placed in a refrigerator at time [latex]t = 0[/latex] (in minutes) and its temperature, [latex]F(t)[/latex], in degrees Fahrenheit, is computed at regular intervals. Based on the data, a model is formulated for the objects temperature, given by
[latex]F(t) = 42 + 30(0.95)^t[/latex]
a. Consider the simpler (parent) function [latex]p(t) = (0.95)^t[/latex]. How do you expect the graph of this function to appear? How will it behave as time increases? Without using graphing technology, sketch a rough graph of p and write a sentence of explanation.
b. For the slightly more complicated function [latex]r(t) = 30(0.95)^t[/latex], how do you expect this function to look in comparison to p? What is the long-range behavior of this function as t increases? Without using graphing technology, sketch a rough graph of r and write a sentence of explanation.
c. Finally, how do you expect the graph of [latex]F(t) = 42+30(0.95)^t[/latex] to appear? Why? First sketch a rough graph without graphing technology, and then use technology to check your thinking and report an accurate, labeled graph on the axes provided in Figure 3.2.11.
d. What is the temperature of the refrigerator? What is the room temperature of the surroundings outside the refrigerator? Why?
Show Solution
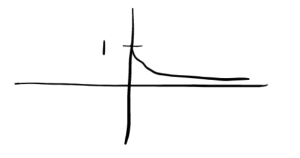
- I wold expect the function [latex]p(t)=(0.95)^t[/latex] to be a decreasing function since [latex]b < 1[/latex]. The y-intercept is [latex](0,1).[/latex] Over time the graph will approach 0.
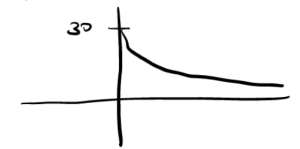
- I would expect the function [latex]r(t)=30(0.95)^t[/latex] to also be a decreasing function since [latex]b < 1.[/latex] The [latex]y[/latex]-intercept is now [latex](0,30)[/latex] and over time the graph will approach 0.
- [latex]F(t)[/latex] will have the same shape shape as [latex]r(t)[/latex]. It is still a decreasing function but now the graph is shifted up by 42. The y intercept is now [latex](0,72)[/latex] and over time the graph will approach 42.
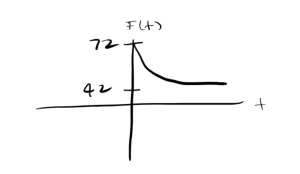
- The room temperature is [latex]72^{\circ}[/latex], since it is the same as the initial temperature of the soda. Over time, the temperature of the soda should match the refrigerator temperature as it sits over time. Thus the temperature of the refrigerator is [latex]42^{\circ}.[/latex]
Examples
Activity 3.2.4. A potato initially at room temperature ([latex]68^{\circ})[/latex] is placed in an oven at [latex](350^{\circ})[/latex] at time [latex]t = 0[/latex]. It is known that the potato's temperature at time t is given by the function [latex]F(t) = a-b(0.98)^t[/latex] for some positive constants [latex]a[/latex] and [latex]b[/latex], where [latex]F[/latex] is measured in degrees Fahrenheit and [latex]t[/latex] is time in minutes.
- What is the numerical value of [latex]F(0)[/latex]? What does this tell you about the value of [latex]a-b[/latex]?
- Based on the context of this problem, what should the long-range behavior of the function [latex]F(t)[/latex]? Use this fact along with the behavior of [latex](0.98)^t[/latex] to determine the value of a. Write a sentence to explain your thinking.
- What is the value of [latex]b[/latex]? Why?
- Check your work above by plotting this function F using graphing technology in an appropriate window. Record your results on the axes provided in Figure 3.2.12, labeling the scale on the axes. Then, use the graph to estimate the time at which the potato's temperature reaches 325 degrees.
- How can we view the function [latex]F(t) = a-b(0.98)^t[/latex]as a transformation of the parent function [latex]f(t) = (0.98)^t[/latex]? Explain.
Show Solution
- F(0) represents the objects initial temperature which is [latex]68^{\circ}.[/latex] So [latex]F(0) = 68[/latex]. [latex]F(0)[/latex]is also what we should get when we plug 0 into [latex]F(t)[/latex]. [latex]F(0) = a-b(0.98)^0 = a-b*1 = a-b[/latex]. Therefore [latex]68 = a-b.[/latex]
- Based on the context of this problem, the long range behavior of the potato is [latex]350^{\circ}[/latex]. As the potato sits in the oven it will match the temperature of the oven which is [latex]350^{\circ}[/latex]. We also know that since [latex]0.98 < 1[/latex] then [latex]F(t)[/latex] is a decreasing function. So, overtime the [latex]F(t)[/latex] will approach its [latex]a[/latex] value, the horizontal asymptote. So a = [latex]350^{\circ}.[/latex]
- Since [latex]65 = a-b[/latex] and we know that [latex]a = 350[/latex], then we can use that to solve for b to get [latex]b = 350 - 65 = 282.[/latex]
-
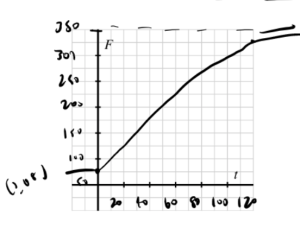
Labeled graph of F(t) on Figure 3.2.12 Based on the graph from Desmos we can estimate it will take about 120 minutes for the graph to reach a temperature of [latex]325^{\circ}.[/latex]
- The function [latex]F(t)[/latex]is a transformation of the parent function [latex]f(t)[/latex] by applying the following transformations
- Vertical stretch of 282
- Reflection over [latex]x[/latex]-axis
- Vertical Shift up by 350
