2.4 Sinusoidal Functions
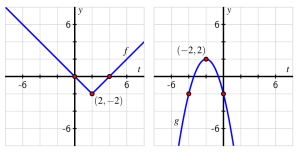
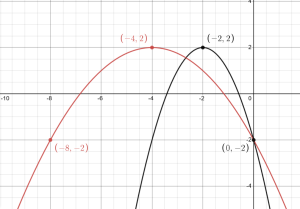
Consider the functions [latex]f[/latex] and [latex]g[/latex] given in Figure 2.4.3 and Figure 2.4.4.
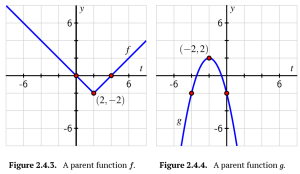
a. On the same axes as the plot of [latex]y=f(t)[/latex], sketch the following graphs: [latex]y=h(t)=f(\frac{1}{3}t)[/latex]and [latex]y=j(t)=r=f(4t)[/latex]. Be sure to label several points on each of [latex]f[/latex], [latex]h[/latex], and [latex]k[/latex] with arrows to indicate their correspondence. In addition, write one sentence to explain the overall transformations that have resulted in [latex]h[/latex] and [latex]j[/latex] from [latex]f[/latex].
b. On the same axes as the plot of [latex]y=g(t)[/latex], sketch the following graphs: [latex]y=k(t)=g(2t)[/latex] and [latex]y=m(t)=g(\frac{1}{2}t)[/latex]. Be sure to label several points on each of [latex]g[/latex], [latex]k[/latex], and [latex]m[/latex] with arrows to indicate their correspondence. In addition, write one sentence to explain the overall transformations that have resulted in [latex]k[/latex] and [latex]m[/latex] from [latex]g[/latex].
c. On the additional copies of the two figures below, sketch the graphs of the following transformed functions: [latex]y=r(t)=2f(\frac{1}{2}t)[/latex] (at left) and [latex]y=s(t)=\frac{1}{2}g(2t)[/latex]. As above, be sure to label several points on each graph and indicate their correspondence to points on the original parent function.
d. Describe in words how the function [latex]y=r(t)=2f(\frac{1}{2}t)[/latex] is the result of two elementary transformations of [latex]y=f(t)[/latex]. Does the order in which these transformations occur matter? Why or why not?
Show Solution
a. [latex]h(t)=f(\frac{1}{3}t)[/latex]
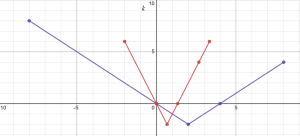
[latex]j(t)=f(4t)[/latex]
[latex]j(t)=f(4t)[/latex]
Function [latex]h[/latex] is function [latex]f[/latex] that has been compressed by a factor of 3. Function [latex]j[/latex] is function [latex]f[/latex] that has been stretched by a factor of 4.
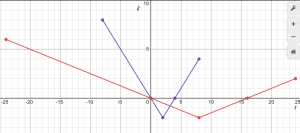
b. [latex]k(t)=g(2t)[/latex]
[latex]m(t)=g(\frac{1}{2}t)[/latex]
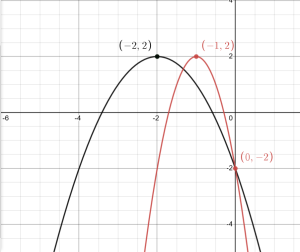
Function [latex]k[/latex] is function [latex]g[/latex] that has been stretched by a factor of 2. Function [latex]m[/latex] is function [latex]g[/latex] that has been compressed by a factor of 2.
c. [latex]r(t)=2f(\frac{1}{2}t)[/latex]
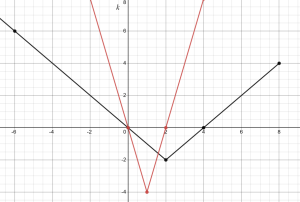
[latex]m(t)=g(\frac{1}{2}t)[/latex]
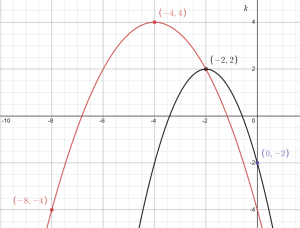
d. Function [latex]r[/latex] is Function [latex]f[/latex] that has been horizontally compressed by a factor of 2 and vertically stretched by a factor of 2. You should do the inside transformation first, then the outside transformation.
Determine the exact period, amplitude, and midline of each of the following functions. In addition, state the range of each function, any horizontal shift that has been introduced to the graph, and identify an anchor point. Make your conclusions without consulting Desmos, and then use the program to check your work.
a. [latex]p(x)=\sin(10x)+2[/latex]
b. [latex]q(x)=-3\cos(0.25x)-4[/latex]
c. [latex]r(x)=2\sin (\frac{\pi}{4}x)+5[/latex]
d. [latex]w(x)=2\cos(\frac{\pi}{2}(x-3))+5[/latex]
e. [latex]u(x)=-0.25\sin(3x-6)+5[/latex]
Show Solution
a. period: [latex]\frac{\pi}{5}[/latex], amplitude: [latex]1[/latex], midline: [latex]y=2[/latex]
Range: [latex][1, 3][/latex]
Horizontal compression by 10
Anchor: [latex](0, 2)[/latex]
b. period: [latex]8\pi[/latex], amplitude: [latex]3[/latex], midline: [latex]y=-4[/latex]
Range: [latex][-7, -1][/latex]
Horizontal stretch by 4
Anchor: [latex](0, -7)[/latex]
c. period: [latex]8[/latex], amplitude: [latex]2[/latex], midline: [latex]y=5[/latex]
Range: [latex][3, 7][/latex]
Horizontal stretch by [latex]\frac{\pi}{4}[/latex]
Anchor: [latex](0, 5)[/latex]
d. period: [latex]4[/latex], amplitude: [latex]2[/latex], midline: [latex]y=5[/latex]
Range: [latex][3, 7][/latex]
Horizontal compression by [latex]\frac{\pi}{2}[/latex]
Anchor: [latex](3, 7)[/latex]
e. period: [latex]\frac{2\pi}{3}[/latex], amplitude: [latex]\frac{1}{4}[/latex], midline: [latex]y=5[/latex]
Range: [latex][4.75, 5.25][/latex]
Horizontal compression by 3
Anchor: [latex](2, 5)[/latex]
