8 Week 6 Statistical Errors Reading
Types of Statistical Error
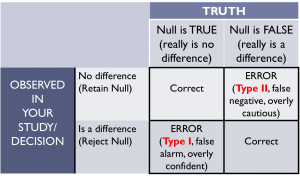
When you sample, there is always the chance that your statistical test gives you one result, when really, another result is true. Sampling is not perfect. Despite your best efforts to get a representative sample, you just may get the opposite results as to what is really true. In other words, your statistical test results say ‘reject the null’ when really, the null was true; or your statistical test says ‘retain the null’, when the null should have been rejected.
Type I Error
A Type I Error occurs when the statistical test rejects the null hypothesis, when the null should have been retained. In other words, you claim that you have found a difference (or a relationship), when really, there was no difference (no relationship).
You can control for this type of error in several ways:
- Increase your sample size
- Select a smaller alpha
Type II Error
A Type II Error occurs when the statistical test retains (fails to reject) the null hypothesis, when the null should have been rejected. In other words, you claim that you did not find evidence of a difference (or a relationship), when really, there was difference (no relationship).
You can control for this type of error in several ways:
- Increase your sample size
- Select a bigger alpha
- Increase the strength of your independent variable with better measuring
- Decrease the variability within your sample
Here’s a good Khan Academy video [5:03] with more about types of statistical error.
Interpreting Statistical Errors in Context
After you’ve identified which type of statistical error could have been made in your study, you will want to interpret it in the context of the problem. Recall the research question: Do the pine trees on campus differ in mean height from the aspen trees? Let’s say that analysis determined that the p-value was less than alpha, so we reject the null. This means that a Type I Error could have occurred. A Type I Error in this context would be interpreted as: The study found that the mean height of pine trees differed from the mean height of aspen trees, when really, the mean heights of the two types of trees did not differ. When you are interpreting a statistical error, it is easiest to say what the study found first, ie your Big Picture Conclusion, then state the opposite was actually true.
Now, if in the case of this tree comparison, you retained the null, p was greater than alpha, then you could possibly have made a Type II Error. In this context, the interpretation would be: The study did not find that the mean height of the pine trees differed from the mean height of aspen trees, when in fact, the mean heights of the two types of trees did differ.
Things to Note
- There is the possibility of a statistical error in ALL hypothesis tests. Rejecting the null means that the error is a Type I. Retaining the null means that the error is a Type II. These are the options that we will cover.
- The likelihood of a statistical error actually having happened depends on the p-value and alpha. The closer that the p-value and alpha are in value, the more likely a statistical error (either of them) could have occurred. You have less concern for the statistical error when p and alpha are further apart. When the two values are very far apart (p=0.89 and alpha=0.05 or p<.0005 and alpha=0.01), then you have little to no concern that the statistical error has happened.
Student Course Learning Objectives
- Choose, administer and interpret the correct tests based on the situation, including identification of appropriate sampling and potential errors
- Differentiate between Type I and Type II errors, explain each in the context of a situation, and describe how to decrease the chances of each.
Attributions
Adapted from “Week 6 Statistical Errors Reading” by Sherri Spriggs and Sandi Dang is licensed under CC BY-NC-SA 4.0.


